Independent research · Federal data · Not a lender or broker
Which lenders fund small businesses, loan by loan.
Everyone in business lending is selling something. We are not - we take no applications, no borrower fees, and no phone numbers. What we have instead is 1,052,071 real SBA loans, restructured so you can see which lenders funded businesses like yours, at what size, at what rate, and how often those loans went bad.
Loans analysed
1,052,071
FY2010 onward
Capital approved
$507.10B
Median loan
$180,000
Median 7(a) rate
6.75%
Lenders profiled
1,519
Franchise brands
1,651
Start where you are
What are you trying to work out?
Four questions cover almost everything a business owner arrives here asking.
Who should I borrow from?
1,500 lender profiles built from federal data - volume, median loan, rate, and losses.
OpenWhat kind of financing fits?
Sixteen instruments ranked by what they truly cost, from SBA money to merchant advances.
OpenCan my business afford it?
Payment, DSCR, and true-APR calculators. No email gate, nothing sent anywhere.
OpenWhat will a franchise cost to finance?
The loan sizes lenders approved for each brand, next to the estimates in its disclosure document.
OpenThe data spine
Sixteen years of federal lending, in one place.
The SBA publishes every 7(a) and 504 loan it has guaranteed - the bank, the rate, the term, the industry, the county, the franchise, and whether the loan was eventually charged off. It publishes it as raw CSV files that almost nobody reads. We read them, quarterly, and turn them into pages.
In FY2025, approvals rose 19.3% in dollar terms against the prior year. The top ten lenders wrote 22% of all dollars approved.
Explore the dataGross approvals by fiscal year
7(a) and 504 combined. The final bar is a partial fiscal year and will grow. Source: U.S. Small Business Administration, as of 2026-06-30.
Nobody can buy a place on this list
The ten largest SBA lenders
Ranked by dollars approved since FY2010, computed from the federal file. Paid placement exists on this site, is labelled, and never enters a ranking.
| # | Lender | Approved | Loans | Median loan | Median rate | Charge-off | Share |
|---|---|---|---|---|---|---|---|
| 1 | Live Oak Banking Company | $23.10B | 17,770 | $850,000 | 6.25% | 3.2% | |
| 2 | The Huntington National Bank | $19.51B | 82,278 | $60,700 | 6.50% | 6.7% | |
| 3 | Wells Fargo Bank | $17.43B | 56,773 | $25,000 | 7.75% | 9.0% | |
| 4 | U.S. Bank | $10.67B | 43,737 | $40,000 | 7.75% | 6.8% | |
| 5 | JPMorgan Chase Bank | $8.49B | 44,082 | $95,000 | 7.40% | 7.8% | |
| 6 | Celtic Bank Corporation | $7.18B | 14,117 | $150,000 | 7.00% | 23.5% | |
| 7 | Byline Bank | $7.16B | 6,400 | $738,000 | 6.25% | 13.9% | |
| 8 | Mortgage Capital Development Corporation | $6.63B | 5,715 | $771,000 | 10.25% | 0.7% | |
| 9 | Newtek Small Business Finance, Inc. | $6.00B | 8,402 | $345,000 | 6.50% | 12.2% | |
| 10 | Newtek Bank | $5.68B | 13,752 | $200,000 | 11.00% | - |
Source: U.S. Small Business Administration, SBA 7(a) and 504 FOIA data, as of 2026-06-30. Approvals from FY2010 onward. How we calculate this.
The decision that costs the most
Cheap money is slow. Fast money is expensive.
The gap between the cheapest and most expensive way to fund the same $100,000 is routinely a factor of ten. The ladder runs like this.
SBA 7(a) loan
Prime + 3% to prime + 6.5%, by loan size
30-90 days
Business line of credit
Prime + 1% to 25%+ APR, by lender type
Same day to 4 weeks
Invoice factoring
1%-5% per 30 days of the invoice face value
1 day to 1 week after setup
Merchant cash advance
Commonly 40%-350% APR equivalent
Same day to 3 days
Ready-made rankings
Start from the question you are asking
Each list is computed from the same federal loan rows, by a formula published on the page.
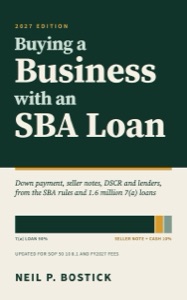
The book · 2027 Edition
Buying a Business with an SBA Loan
How Much You Can Pay, What You Must Put Down, and What 1.6 Million SBA Loans Reveal About the Risk. SOP 50 10 8.1 read line by line, and the SBA’s record of 1,624,422 7(a) loans analyzed, with the tables and code published.
- There is no SBA route to "no money down" for a first acquisition.Chapter 7
- The coverage test sets the price a lender will finance.Chapter 5
- When a loan was made predicts loss more than what it financed.Chapter 11
On Amazon: Paperback $24.99 · Hardcover $34.99 · Kindle $9.99
Written by this site's owner, who earns royalties from its sale. The Amazon links are plain links, not affiliate links.
By state
Where the capital lands
By industry
Most-financed businesses
In plain words
How this site makes money
When you click through to a lender we have a partnership with, we may be paid a referral fee by that lender. That is the business model, in full. We are never paid by a business seeking capital, we take no application, and we do not sell, share, or broker your information - because we never collect it.
Paid placement exists and is labelled “Sponsored” wherever it appears. It sits in its own lane and cannot enter a ranking: every league table on this site is computed from the SBA’s file by a formula we publish. A lender cannot buy a higher position, a better charge-off number, or the removal of an unflattering one.
We never take an application
There is no form on this site that asks for revenue, credit score, EIN, or a phone number. Lenders collect that; we do not want it.
We are a publisher, not a broker
We do not originate, arrange, negotiate, or service financing, and we take no fee from any business seeking capital.
The calculators send nothing
Every tool runs in your browser. Nothing you enter reaches a server, ours or anyone else's.
Quarterly
When the numbers change, we tell you
The SBA refreshes its loan file every quarter. When it does, we rerun everything and send one email covering what moved - approval volume, median rates, which lenders grew and which pulled back. Four times a year. No phone number asked for, so we have no way to call you.
The quarterly ledger
What changed in small business lending
When the SBA refreshes its data, we rerun the numbers and send what moved - approval volume, rates, which lenders grew, which pulled back. Four emails a year. No sales calls, ever.
Your name is optional - we never ask for your phone number, revenue, or credit score, and we do not sell or share your address. Privacy.